CMTI function to fit the temperature cardinal model (Rosso et al, 1993).
Returns the model parameters estimated according to data collected in microbial growth experiments.
Details
The model's inputs are:
x: Temperature
sqrtGR: the square root of the growth rate (\(h^{-1}\))
Users should make sure that the growth rate input is entered after a square root transformation, sqrGR = sqrt(GR).
References
Rosso L, Lobry J, Charles (Bajard) S, Flandrois J (1995). “Convenient Model To Describe the Combined Effects of Temperature and pH on Microbial Growth.” Applied and environmental microbiology, 61, 610–6. doi:10.1128/AEM.61.2.610-616.1995 .
Author
Vasco Cadavez vcadavez@ipb.pt and Ursula Gonzales-Barron ubarron@ipb.pt
Examples
library(gslnls)
data(salmonella)
initial_values <- list(Tmax = 42, Tmin = 1, MUopt = 1.0, Topt = 37)
fit <- gsl_nls(sqrtGR ~ CMTI(Temp, Tmax, Tmin, MUopt, Topt),
data = salmonella,
start = initial_values
)
summary(fit)
#>
#> Formula: sqrtGR ~ CMTI(Temp, Tmax, Tmin, MUopt, Topt)
#>
#> Parameters:
#> Estimate Std. Error t value Pr(>|t|)
#> Tmax 49.03256 0.13336 367.68 < 2e-16 ***
#> Tmin 5.02679 0.37058 13.56 1.51e-10 ***
#> MUopt 0.75206 0.01156 65.05 < 2e-16 ***
#> Topt 40.36709 0.24985 161.56 < 2e-16 ***
#> ---
#> Signif. codes: 0 ‘***’ 0.001 ‘**’ 0.01 ‘*’ 0.05 ‘.’ 0.1 ‘ ’ 1
#>
#> Residual standard error: 0.01718 on 17 degrees of freedom
#>
#> Number of iterations to convergence: 44
#> Achieved convergence tolerance: 7.98e-17
#>
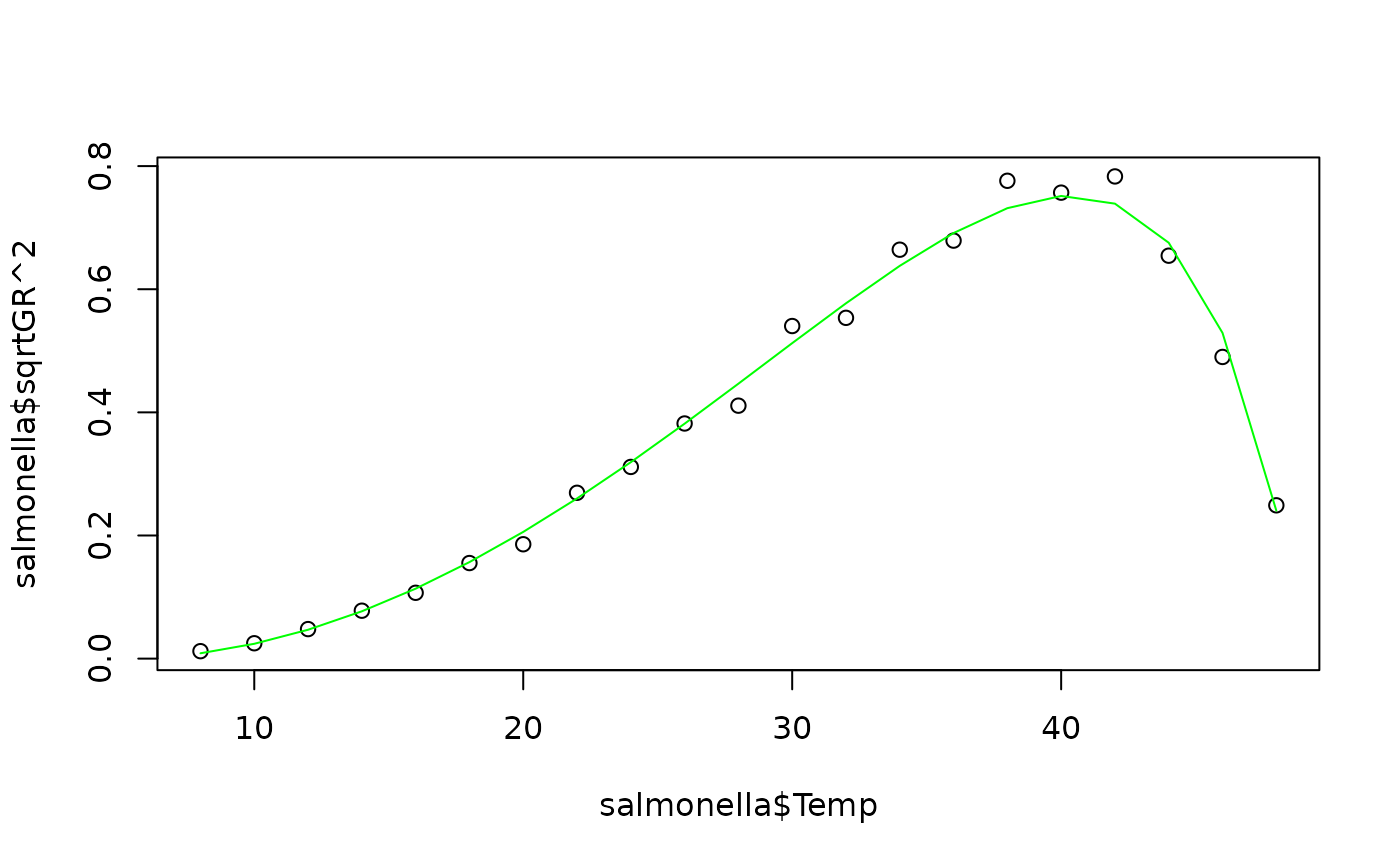
plot(salmonella$Temp, salmonella$sqrtGR^2)
lines(salmonella$Temp, fitted(fit)^2, col = "green")
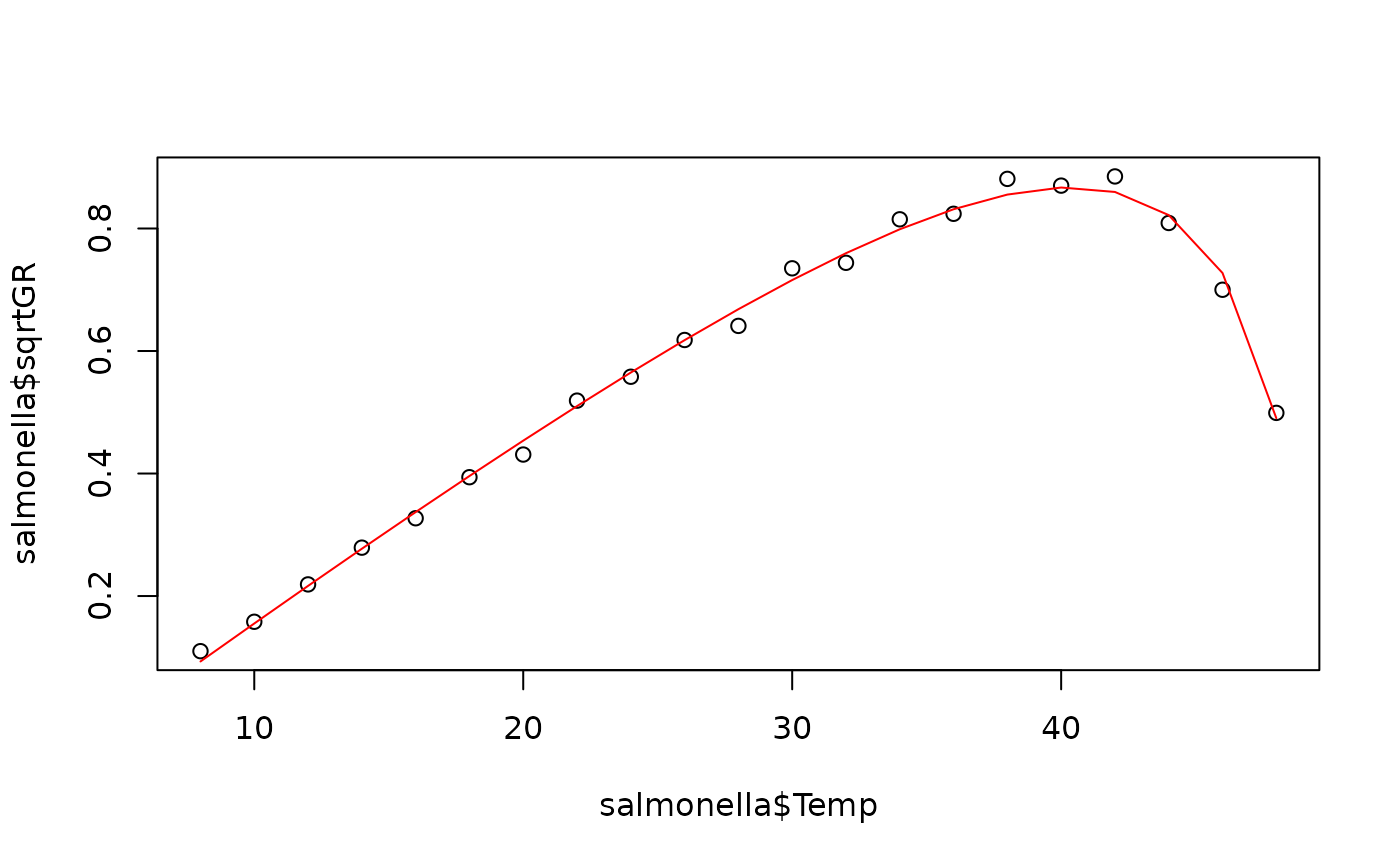
 plot(salmonella$Temp, salmonella$sqrtGR)
lines(salmonella$Temp, fitted(fit), col = "red")
plot(salmonella$Temp, salmonella$sqrtGR)
lines(salmonella$Temp, fitted(fit), col = "red")