Weibull inactivation modified model Mafart
Source:R/weibull_inactivation_modified_mafart.R
WeibullMM.RdWeibullMM inactivation model for microbial inactivation curve.
Returns the model parameters estimated according to data collected in microbial inactivation experiments.
Arguments
- x
is a numeric vector indicating the heating time under a constant temperature of the experiment
- Y0
is the log10 of the initial bacterial concentration (at time t=0)
- Yres
is the log10 of the residual bacterial concentration (at the end of the experiment)
- sigma
represents the time of the first decimal reduction concentration for the part of the population not belonging to Yres
- alpha
is the shape parameter and allows to catch the curve concavity or convexity
Details
The model's inputs are:
t: time, assuming time zero as the beginning of the experiment.
Y(t): the bacterial concentration ($Y(t)$) measured at time t.
Users should make sure to use the base 10 logarithm bacterial concentration (Y(t)) as input.
Author
Vasco Cadavez vcadavez@ipb.pt and Ursula Gonzales-Barron ubarron@ipb.pt
Examples
library(gslnls)
data(bixina)
initial_values <- list(Y0 = 5.6, Yres = 1, sigma = 2, alpha = 1)
bixina$logN <- log10(exp(bixina$lnN))
fit <- gsl_nls(logN ~ WeibullMM(Time, Y0, Yres, sigma, alpha),
data = bixina,
start = initial_values
)
summary(fit)
#>
#> Formula: logN ~ WeibullMM(Time, Y0, Yres, sigma, alpha)
#>
#> Parameters:
#> Estimate Std. Error t value Pr(>|t|)
#> Y0 2.403e+00 1.829e-02 131.399 < 2e-16 ***
#> Yres -6.220e+00 4.897e+06 0.000 1
#> sigma 1.287e+01 6.828e-01 18.853 2.39e-11 ***
#> alpha 2.395e+00 2.720e-01 8.807 4.40e-07 ***
#> ---
#> Signif. codes: 0 ‘***’ 0.001 ‘**’ 0.01 ‘*’ 0.05 ‘.’ 0.1 ‘ ’ 1
#>
#> Residual standard error: 0.04348 on 14 degrees of freedom
#>
#> Number of iterations to convergence: 38
#> Achieved convergence tolerance: 1.159e-11
#>
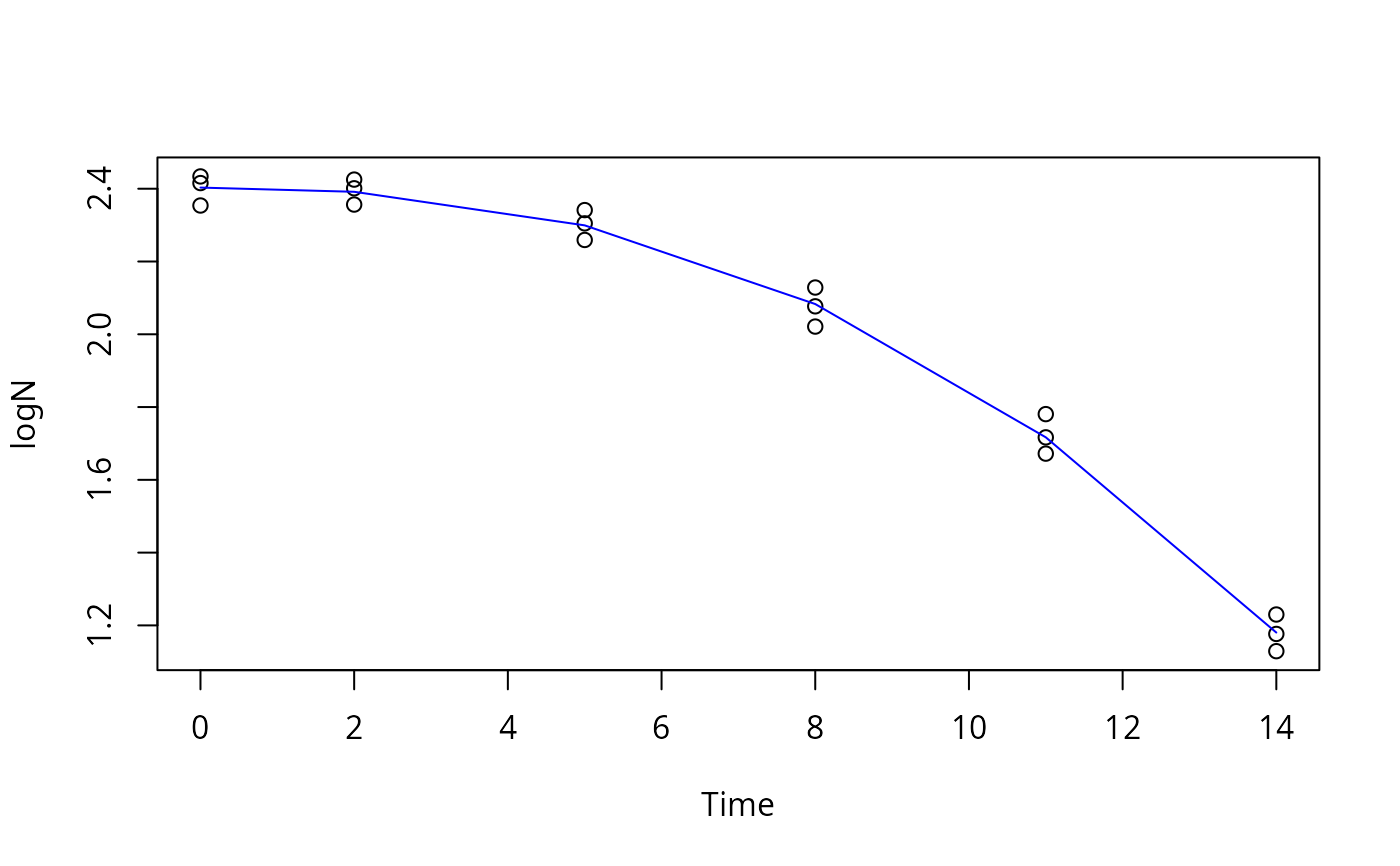
plot(logN ~ Time, data = bixina)
lines(bixina$Time, predict(fit), col = "blue")